R语言作为一门统计计算和数据可视化为核心特色的工具性语言,其在可视化领域或者说数据呈现方面有着非常成熟和系统的解决方案。
这里所说的解决方案不仅是指R语言里面有诸多的图形语法系统(比如base系统、grid系统、lattic系统等),更重要的是它拥有(目前比较成熟的)系统级输出方案,你可以理解为如何在项目中从一而终的组织你的分析内容、图形布局、输出方法等。
其一是shiny+shinydashboard+诸多可视化系统及组件(图表、表格、文本信息),shinydashboard是相当于前端UI模板化的R语言api接口,你可以以R语法的格式去配置交互控件以及组织页面逻辑,整合成含有UI层和服务层的微型响应式可视化构架。这对于既想在数据可视化上追求更优质体验但是又不具备前端开发能力的数据分析或者数据科学从业者而言绝对是一个福音。(当然如果你是计算机领域出身的数据人,当我没说)。
官方主页地址(含文档)
http://rstudio.github.io/shinydashboard/
之前演示过几个shiny可视化的案例,总体而言效果不错,不过因为工作中还没有设计完整项目应用,对于服务端的优化和部署尚没有很好地把握。
第二套框架便是使用rmarkdown+flexdashboard+可视化组间(各种图形语法以及表格、文本信息等),rmarkdown是基于通用markdwon语法深度扩展的R语言markdown实现,在保留通用标记语法的基础上扩展了相当多的应用场景。
flexdashboard与shiny中的扩展shinydoahboard异曲同工,将rmarkdown扩展除了灵活布局能力,使其基本具备了开发简易仪表盘的能力,而且兼容性很好,不仅可以满足本地各种格式的输出(docx、pdf、及各种tex格式),而且可以输出html网页。
rmarkdown的语法更加简洁、直观、低门槛,与shiny比起来学习门槛要小很多,两者的区别除了表面的差异之外,rmarkdown是基于yaml+knitr来渲染的,应该没有后台服务支持,输出是一次性的。但是shiny是有服务端支持的,可以实现动态传参、动态刷新。除此之外shiny的ui定制化程度更好,因为具备html+css+js嵌入功能(当然需要具备开发能力)。
本篇仅就其中的rmarkdown以flexdashhoard进行分享,内容框架取自https://rmarkdown.rstudio.com/flexdashboard/,建议看源文档可以学习的更加系统。
rmarkdown支持的可视化(主要得益于flexdashboard赋予的扩展能力)组件主要包含以下几种:
graphics:base、lattice、grid(ggplot2)、htmlwidgets(基于js可视化库封装的api接口)
tabular:即表格,典型的如DT、ktable等
gauges:单值仪表盘
vlaues boxes:即指标卡
text annotations:即文本框、注释块等(随便叫)
flexdashboard的核心布局理念是基于行列的矩阵型布局,即整个文档都是在操纵行列布局,以及侧边栏和tab切换。
而其中的Components(所有可视化组间的统称)则会基于规定好的行列按照规则自适应。(在有限的空间内根据屏幕变化自适应)。
flexdashboard支持故事版功能(很好用的功能,与tableau中的故事版如出一辙)。
flexdashboard同时也支持将shiny部件嵌入文档来实现可视化的动态更新。
#安装
install.packages("rmarkdown")
install.packages("flexdashboard")
---
title: "Single Column (Fill)"
output:
flexdashboard::flex_dashboard:
vertical_layout: fill
---
### Chart 1
```{r}
library("ggplot2")
ggplot(aes(x=mpg, y=wt), data = mtcars) +
geom_point+
geom_smooth
```
### Chart 2
```{r}
wdata <- data.frame(
sex=factor(rep(c("F", "M"), each=200)),
weight=c(rnorm(200, 55), rnorm(200, 58))
)
ggplot(data = wdata,aes(x = weight, fill=sex)) +
geom_histogram
```
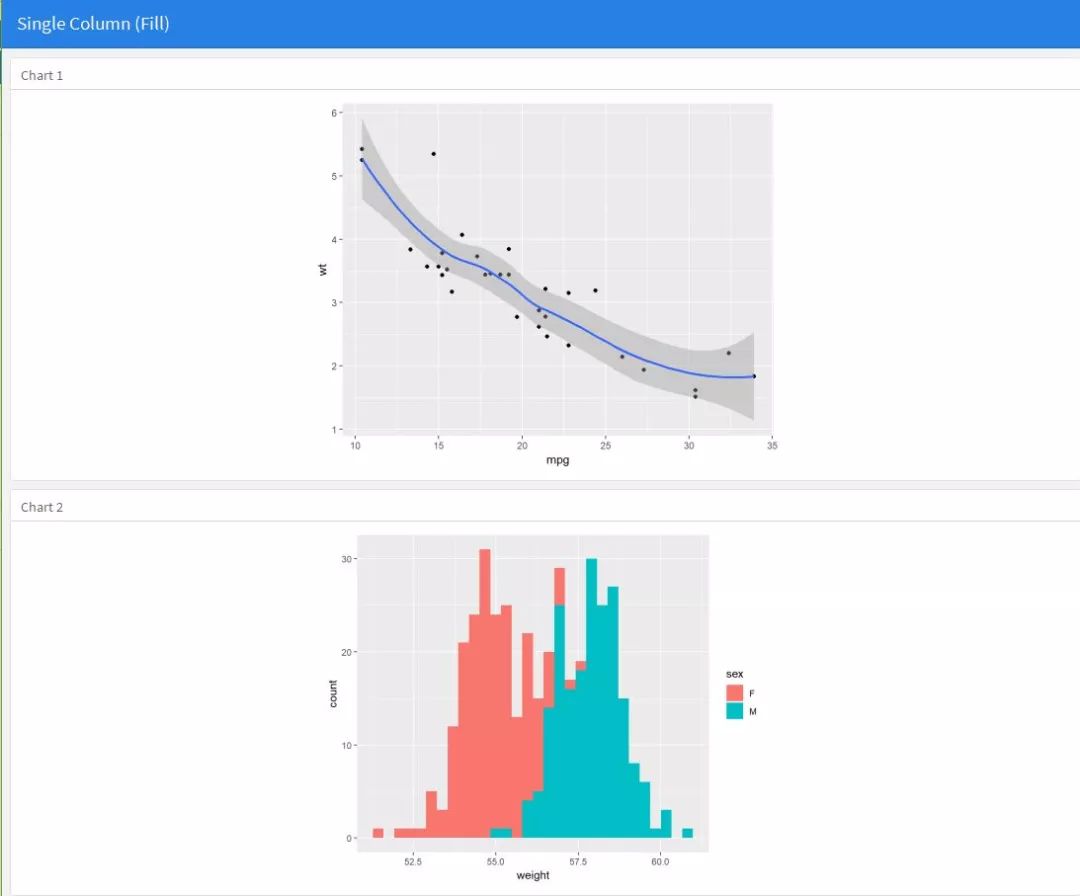
其中yaml的头文件中vertical_layout参数用于控制整个图标布局的行列布局规则,vertical_layout: fill效果为自动按列布局。
---
title: "Single Column (Fill)"
output:
flexdashboard::flex_dashboard:
vertical_layout:scroll
---
### Chart 1
```{r}
library("ggplot2")
ggplot(aes(x=mpg, y=wt), data = mtcars) +
geom_point+
geom_smooth
```
### Chart 2
```{r}
wdata <- data.frame(
sex=factor(rep(c("F", "M"), each=200)),
weight=c(rnorm(200, 55), rnorm(200, 58))
)
ggplot(data = wdata,aes(x = weight, fill=sex)) +
geom_histogram
```
### Chart 3
```{r}
ggplot(mpg, aes(displ, hwy, colour = class)) +
geom_point
```
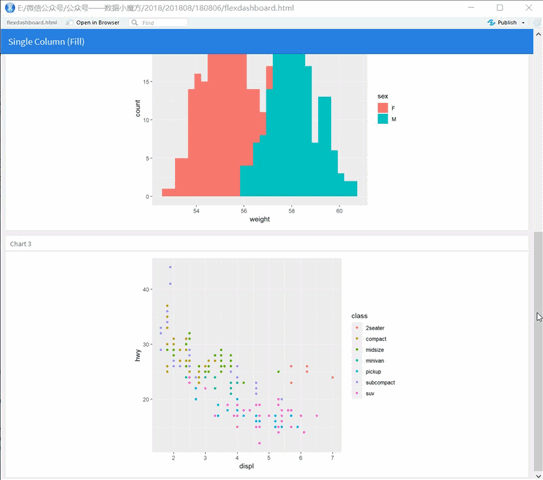
当vertical_layout参数为scroll时,打开的页面浏览器中图表会保持原始大小不变,倘若竖排的所有图表高度之和大于页面浏览器窗口,则会自动启动垂直滚动功能(区别于vertical_layout参数为fill时,所有图表的高度会根据当前页面浏览器高度自适应调整)。
Page Navigation——导航页支持二级菜单选择
Multiple Columns
当然flexdashboard可以支持多列布局,只需要在代码中声明列参数即可,而且可以自定义各列的列宽。
---
title: "Multiple Columns"
output: flexdashboard::flex_dashboard
---
Column {data-width=600}
--------------------
### Chart 1
```{r}
library("ggplot2")
wdata <- data.frame(
sex=factor(rep(c("F", "M"), each=200)),
weight=c(rnorm(200, 55), rnorm(200, 58))
)
ggplot(data = wdata,aes(x = weight, fill=sex)) +
geom_histogram
```
Column {data-width=400}
-------------------------------------
### Chart 2
```{r}
ggplot(aes(x=mpg, y=wt), data = mtcars) +
geom_point+
geom_smooth
```
### Chart 3
```{r}
ggplot(mpg, aes(displ, hwy, colour = class)) +
geom_point
```
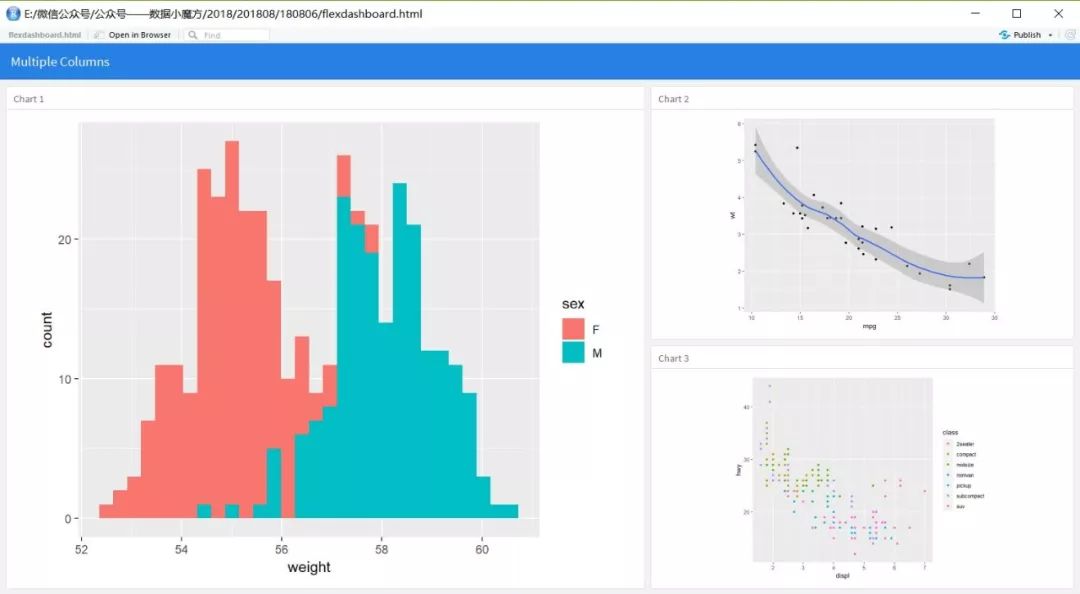
可以看到这里的多列布局只要是通过Column {data-width=400}外加三个以上的短横线组成的分割线来控制的,分割线在markdown的通用语法中往往是用于分段的意思,这里则用于分割图表模块。
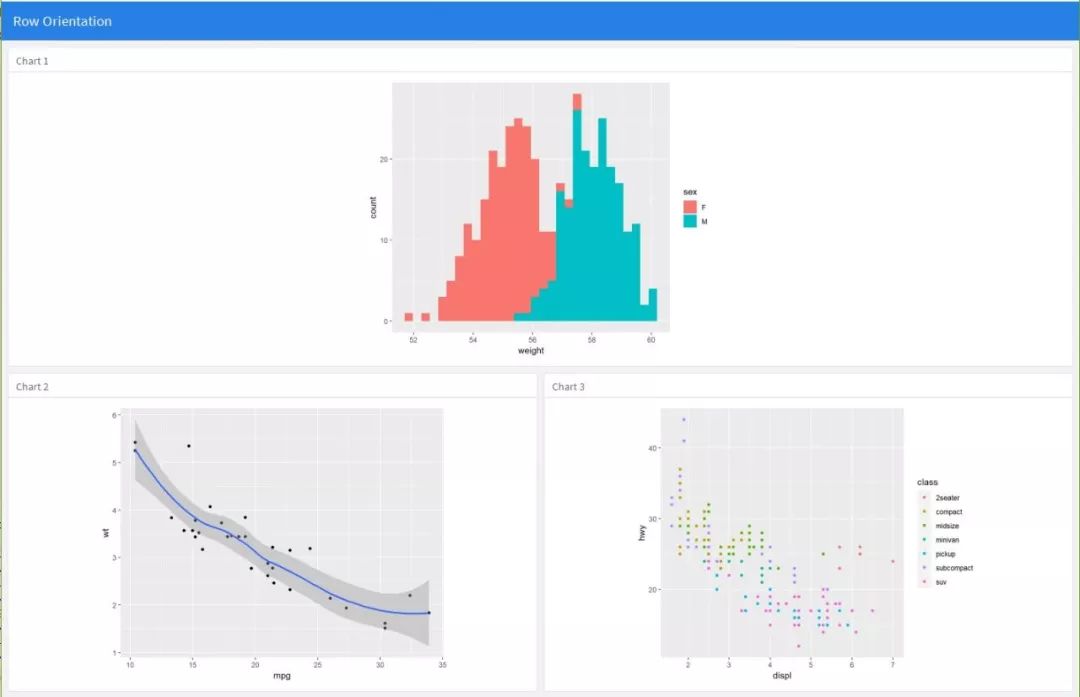
Row Orientation
多行布局也多列布局很相似,仅需将声明列改为声明行即可。
Tabsets——页面切换按钮
使用flexdashoard中的tab功能可以组织页面切换效果:
---
title: "Tabset Column"
output: flexdashboard::flex_dashboard
---
Column
--------------------
### Chart 1
```{r}
library("ggplot2")
wdata <- data.frame(
sex=factor(rep(c("F", "M"), each=200)),
weight=c(rnorm(200, 55), rnorm(200, 58))
)
ggplot(data = wdata,aes(x = weight, fill=sex)) +
geom_histogram
```
Column {.tabset}
-------------------------------------
### Chart 2
```{r}
ggplot(aes(x=mpg, y=wt), data = mtcars) +
geom_point+
geom_smooth
```
### Chart 3
```{r}
ggplot(mpg, aes(displ, hwy, colour = class)) +
geom_point
```
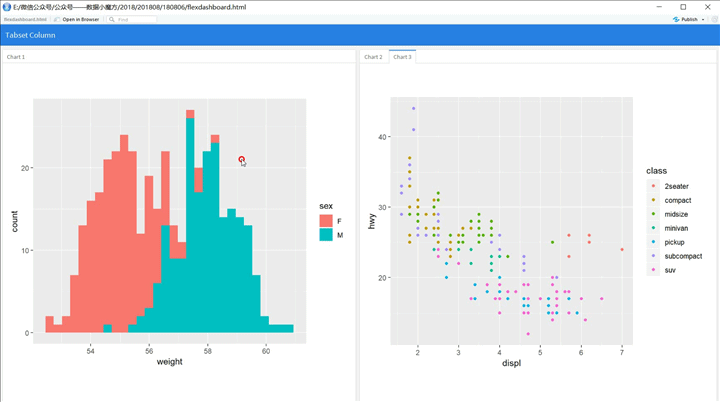
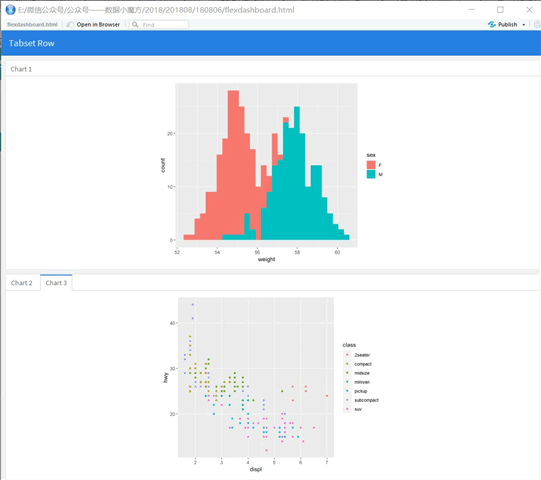
tab切换功能核心在于在声明列参数后面的花括号中指定tabset参数。
Html Widgets
html widgets部件是R语言中很有特色的一类交互式动态可视化组间,这些组间通常是封装的第三方js可视化库,而且调用非常简单,也不需要调整太多的美化参数(因为都是底层定制好的)。
比较典型的几个HTML Widgets是:
- Leaflet
- dygraphs
- Poltly
- rbokeh
- Highcharter
- visNetwork
- DT
如果你对这些交互式绘图组间,可以参考HTML widgets的主页:
http://www.htmlwidgets.org/
引用这些组间的方法很简单,并无特别之处:
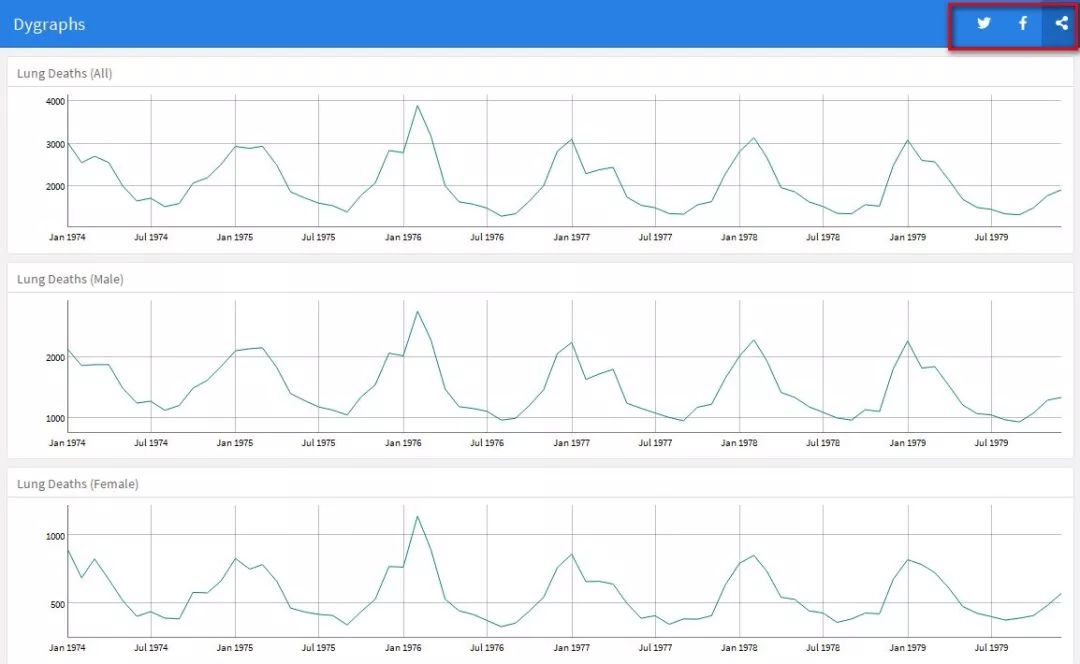
---
title: "Dygraphs"
output:
flexdashboard::flex_dashboard:
orientation: columns
---
```{r setup, include=FALSE}
library(dygraphs)
library(flexdashboard)
```
### Lung Deaths (All)
```{r}
dygraph(ldeaths)
```
### Lung Deaths (Male)
```{r}
dygraph(mdeaths)
```
### Lung Deaths (Female)
```{r}
dygraph(fdeaths)
```
R Graphics
使用renderPlot输出的shiny图形组件,可以直接dashboard的控件布局,直接输出的R内置图形可以支持自定义单个图形的长款尺寸。
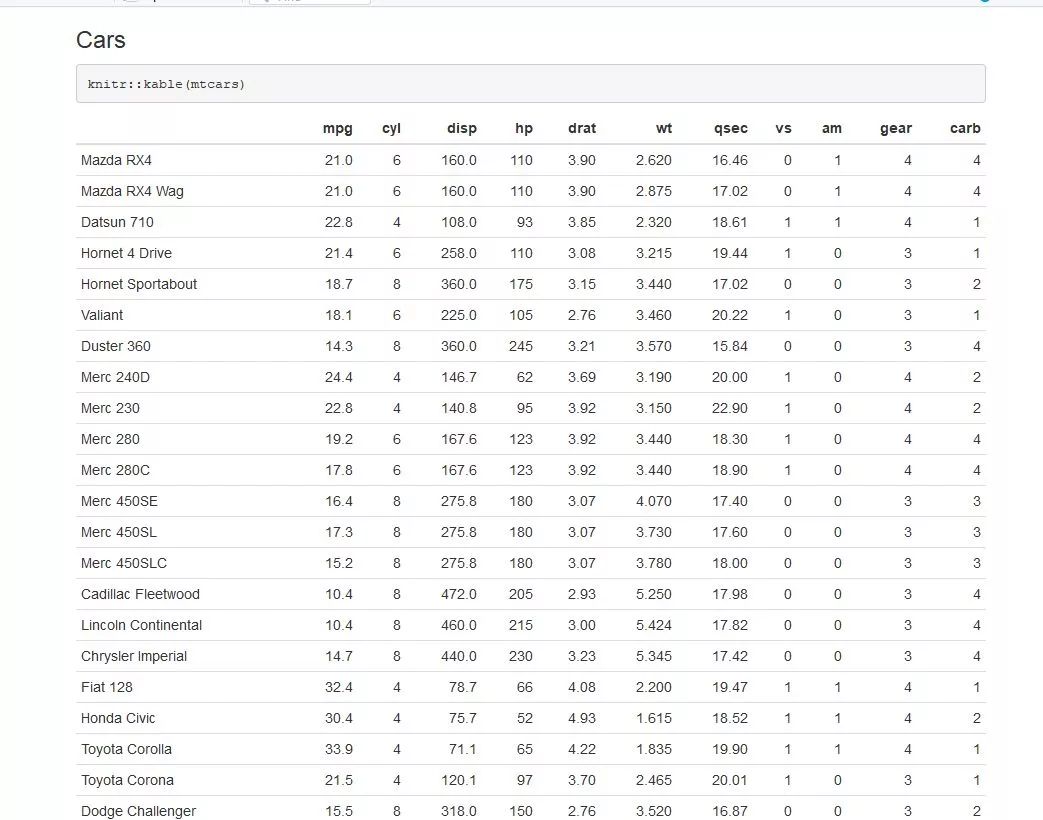
Tabular Data —— 表格
表格输出一般有两种情况,仅输出原生表格或者使用shiny中的renderTable函数封装动态更新的表格。
### Cars
```{r}
knitr::kable(mtcars)
```
Data Table
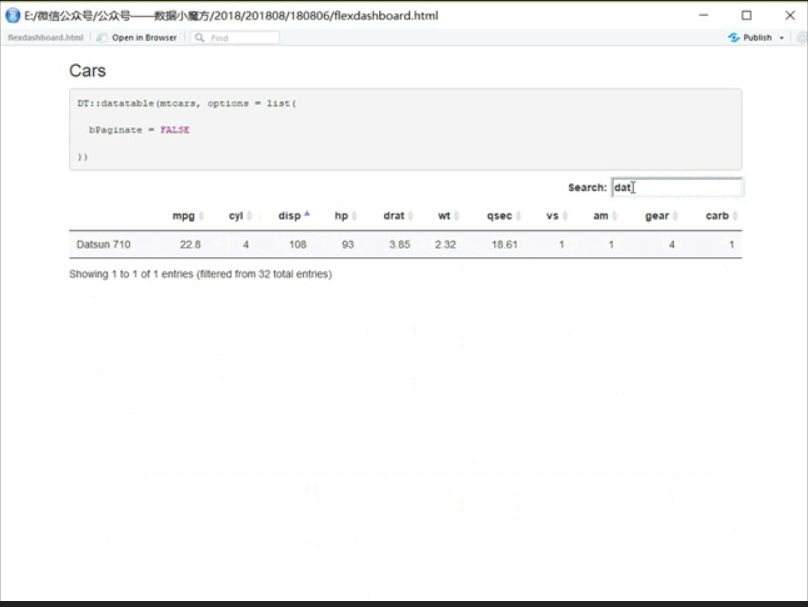
DT包输出的表格支持动态筛选和分页功能,交互体验很有特色。
### Cars
```{r}
DT::datatable(mtcars, options = list( bPaginate = FALSE))
```
以下是分页的参数,主要用于分割大数据集的呈现体验
### Cars
```{r}
DT::datatable(mtcars, options = list(pageLength = 25))
```
DT包通过renderDataTable函数封装,可以实现通过全局控件交互来动态更新呈现出的图表,DT::datatable自身的交互功能的使用场景是很受限的。
### Cars
```{r}
DT::renderDataTable({
data <- head(mtcars, n = input$maxrows)
DT::datatable(data, options = list(
bPaginate = FALSE
))
})
```
Value Boxes
alue Boxes是指指标卡部件,它直接可以调用线上的前端UI库来实现自定义图标、背景和风格等。
Row
-----------------------------------------------------------------------
### Articles per Day
```{r}
articles <- computeArticles
valueBox(articles, icon = "fa-pencil")
```
### Comments per Day
```{r}
comments <- computeComments
valueBox(comments, icon = "fa-comments")
```
### Spam per Day
```{r}
spam <- computeSpam
valueBox(spam,icon = "fa-trash",
color = ifelse(spam > 10,"warning", "primary"))
```
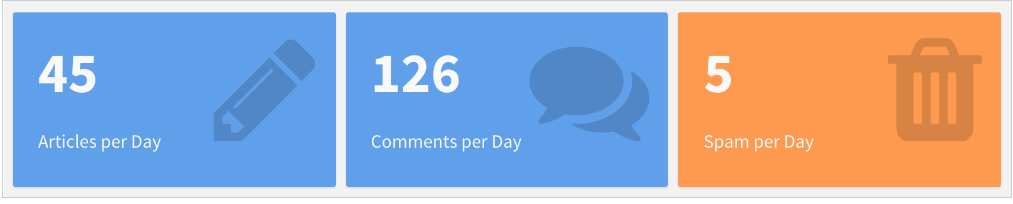
这里的icon支持直接从在线ui库中获取:
Icon Sets
You can specify icons from three different icon sets:
Font Awesome——https://fontawesome.com/icons?from=io
Ionicons——https://ionicons.com/
Bootstrap Glyphicons——https://getbootstrap.com/docs/3.3/components/
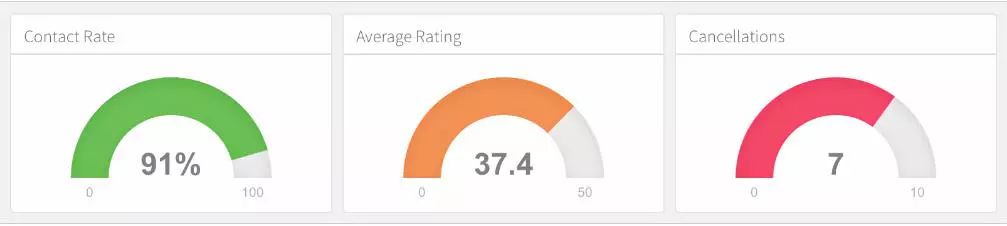
Gauges
Gauges是单值仪表盘,很适合用于呈现单值指标:
Gauges也可以直接用在shiny插件中,嵌入rmarkdown文档,实现动态更新数据
### Contact Rate
```{r}
renderGauge({
rate <- computeContactRate(input$region)
gauge(rate, min = 0, max = 100, symbol = '%', gaugeSectors(
success = c(80, 100), warning = c(40, 79), danger = c(0, 39)
))
})
```
Navigation Bar
flexdashboard可以支持顶部导航条功能:
---
title: "Navigation Bar"
output:
flexdashboard::flex_dashboard:
navbar:
- { title: "About", href: "https://example.com/about", align: left }
---
Social Links
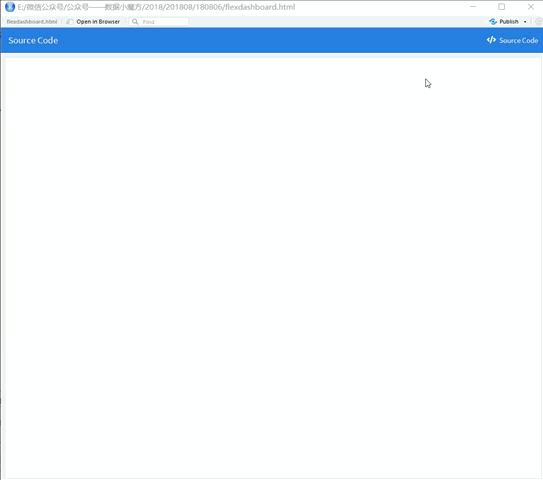
可以在yaml语法头文件中声明该dashboard嵌入源代码,点击连接即可跳转至源代码页面。
---
title: "Source Code"
output:
flexdashboard::flex_dashboard:
source_code: embed
---
Text Annotations
文本块即不做任何代码修饰正文,随便写就好。
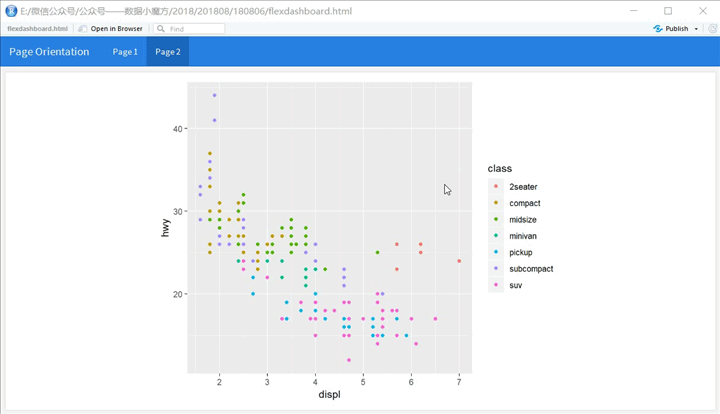
Page Orientation(页面导航页)
---
title: "Page Orientation"
output: flexdashboard::flex_dashboard
---
Page 1
=====================================
### Chart 2
```{r}
library("ggplot2")
wdata <- data.frame(
sex=factor(rep(c("F", "M"), each=200)),
weight=c(rnorm(200, 55), rnorm(200, 58))
)
ggplot(data = wdata,aes(x = weight, fill=sex)) +
geom_histogram
```
Page 2 {data-orientation=rows}
=====================================
```{r}
ggplot(mpg, aes(displ, hwy, colour = class)) +
geom_point
```
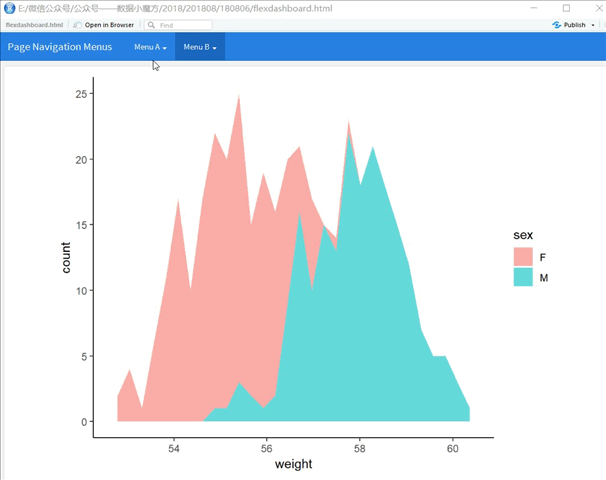
Page Navigation(页面二级导航页)
---
title: "Page Navigation Menus"
output: flexdashboard::flex_dashboard
---
Page 1 {data-navmenu="Menu A"}
=====================================
```{r}
library("ggplot2")
ggplot(aes(x=mpg, y=wt), data = mtcars) +
geom_point+
geom_smooth
```
Page 2 {data-navmenu="Menu A"}
=====================================
```{r}
wdata <- data.frame(
sex=factor(rep(c("F", "M"), each=200)),
weight=c(rnorm(200, 55), rnorm(200, 58))
)
ggplot(data = wdata,aes(x = weight, fill=sex)) +
geom_histogram
```
Page 3 {data-navmenu="Menu B"}
=====================================
```{r}
ggplot(mpg, aes(displ, hwy, colour = class)) +
geom_point
```
Page 4 {data-navmenu="Menu B"}
=====================================
```{r}
library(plyr)
mu <- ddply(wdata, "sex", summarise, grp.mean=mean(weight))
ggplot(wdata, aes(x=weight)) +
geom_area(aes(fill=sex), stat = "bin", alpha=0.6)+
theme_classic
```
Page Links——页面内链接
---
title: "Page Links"
output: flexdashboard::flex_dashboard
---
Page 1
=====================================
Page Links
You can link to a dashboard page with either of the following syntaxes:
[Page 2]
[Page Two](#page-2)
The second syntax is used when you want a custom name for the link
(rather than just using the page title).
### Chart A
```{r}
library(plyr)
library(ggplot2)
wdata <- data.frame(
sex=factor(rep(c("F", "M"), each=200)),
weight=c(rnorm(200, 55), rnorm(200, 58))
)
mu <- ddply(wdata, "sex", summarise, grp.mean=mean(weight))
ggplot(wdata, aes(x=weight)) +
geom_area(aes(fill=sex), stat = "bin", alpha=0.6)+
theme_classic
```
Page 2
=====================================
### Chart B
```{r}
library("ggplot2")
ggplot(aes(x=mpg, y=wt), data = mtcars) +
geom_point+
geom_smooth
```
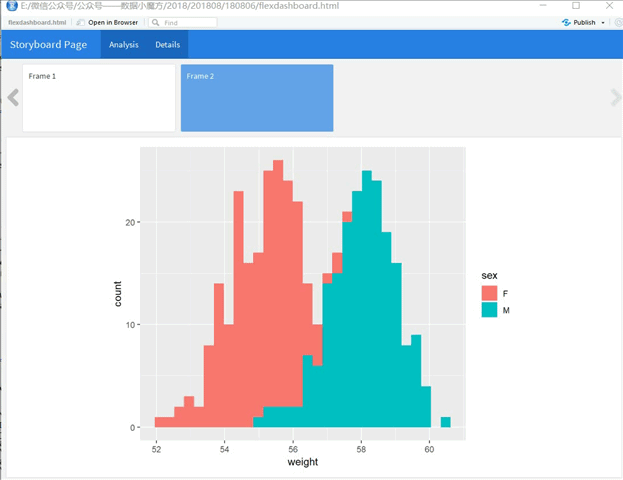
StoryBoard——故事版
---
title: "Storyboard Page"
output: flexdashboard::flex_dashboard
---
Analysis {.storyboard}
=========================================
### Frame 1
```{r}
library("ggplot2")
ggplot(mpg, aes(displ, hwy, colour = class)) +
geom_point
```
### Frame 2
```{r}
library("ggplot2")
wdata <- data.frame(
sex=factor(rep(c("F", "M"), each=200)),
weight=c(rnorm(200, 55), rnorm(200, 58))
)
ggplot(data = wdata,aes(x = weight, fill=sex)) +
geom_histogram
```
Details
=========================================
Column
-----------------------------------------
以上便是flexdashboard的主要功能,由于flexdashboard支持嵌入shiny,所以算上shiny+shinydashboard的更为强大的交互功能,就更无敌了。flexdashboard可以作为数据产品原型开发的样板(shinydashboard也是),期待大家使用这些工具做出更好的工具,一起来分享心得。
当然以上仅仅是flexdashboard的相关核心应用,如果你之前已经有过书写markdown的经验的话,那你得学习负担会小一些,仅需着重记忆flexdashboard的参数配置即可,如果没有,可能需要从新学习一下markdown的通用标记语法(不用担心,一共没有几个知识点)。
一下是一篇不错的rmarkdown通用语法标记及其配置参数的心得总结:
https://www.cnblogs.com/nxld/p/6074412.html- 本文固定链接: https://maimengkong.com/morejc/1059.html
- 转载请注明: : 萌小白 2022年6月28日 于 卖萌控的博客 发表
- 百度已收录