作者:作图丫
背景介绍
通常我们进行功能富集分析,对基因集进行功能注释的时候,往往会得到大量显著富集的功能,今天小编给大家介绍的simplifyEnrichment包,就可以通过binary cut的方法,将GOSemSim得到的GO相似度矩阵进行划分,从而将GO划分为几个类,通过注释就可以知道每个类对应的功能是什么。
R包安装
01简化GO富集分析结果
simpleEnrichment 主要是通过对GO terms的相应语义相似度矩阵进行聚类来简化 GO 富集分析结果。我们首先从Biological Process(BP)中生成一个随机 go id 列表:
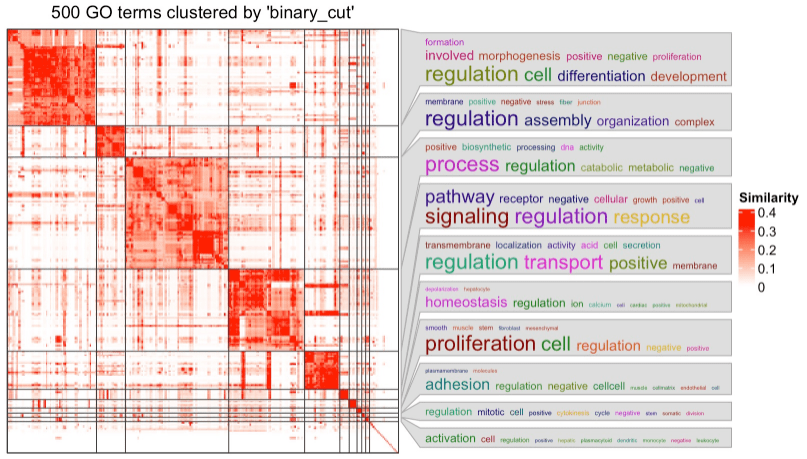
我们可以直接用simpleGO 函数来执行聚类以及可视化结果。
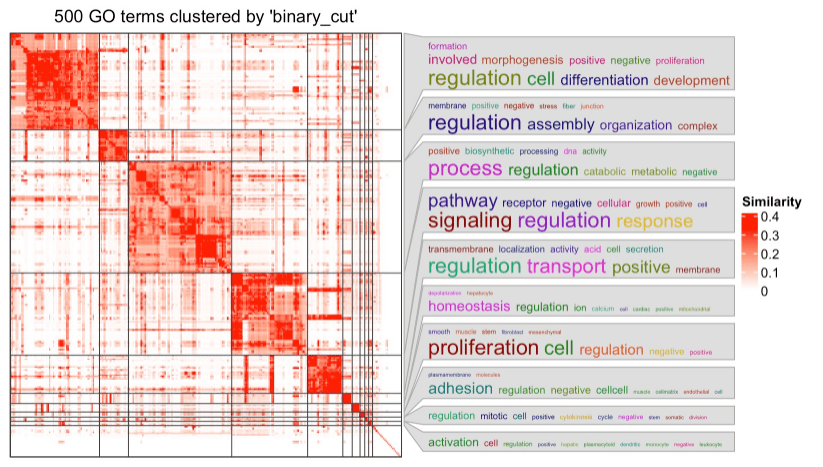
在热图的右侧,有词云注释,用关键字总结了每个 GO cluster中的功能。
返回的变量 df 是一个带有 go id、GO terms和cluster标签的数据框:
02聚类方法比较
在simpleEnrichment 包中,还有比较不同方法的聚类结果的函数。这里仍然使用先前生成的变量 mat。使用compare_clustering_methods 函数即可进行各种聚类结果的比较。
结果包括:①、将不同聚类作为行注释的相似性矩阵的热图。
②、聚类结果一致性的热图
③、每种方法的差异分数的条形图
④、聚类数
⑤、相同聚类中的terms的平均相似度
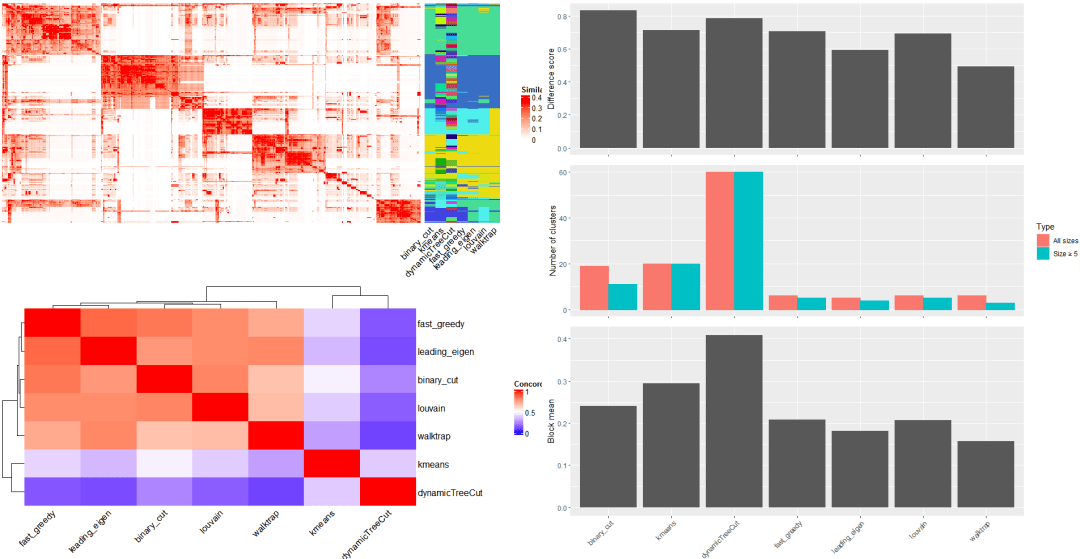
如果 plot_type 参数设置为heatmap,会展示不同聚类方法下的相似度矩阵热图。 最后是一个包含cluster数量的表格。

03应用于多个go id列表
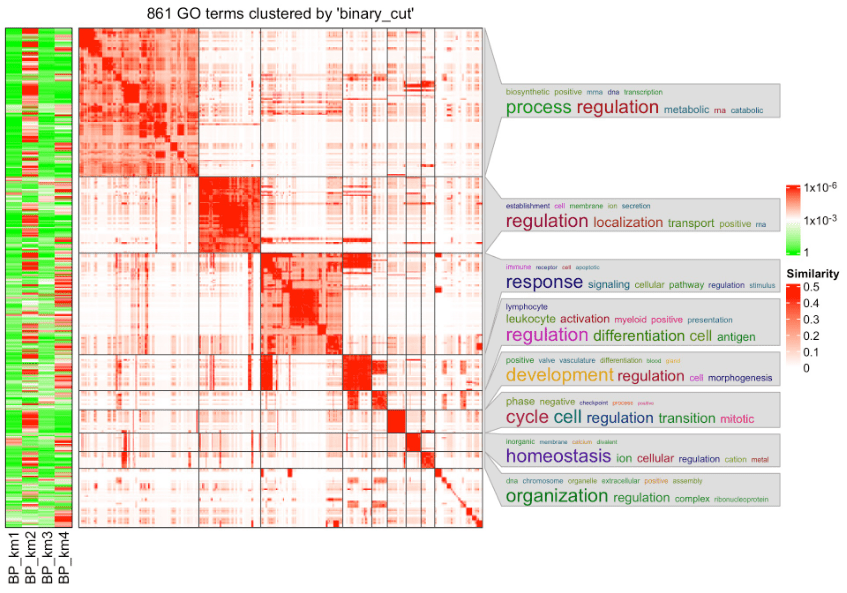
如果有多个 GO 富集结果列表(比如来自多组基因),并且想要比较不同列表之间的显著项。simplifyEnrichment包中有一个函数simpleGOFromMultipleLists 可以进行这种类型的分析。
library(cola)data(golub_cola) res = golub_cola["ATC:skmeans"]
library(hu6800.db)x = hu6800ENTREZIDmapped_probes = mappedkeys(x)id_mapping = unlist(as.list(x[mapped_probes]))
lt = functional_enrichment(res, k = 3, id_mapping = id_mappinghead(lt[[1]][, 1:7])## ID Deion GeneRatio BgRatio## GO:0033993 GO:0033993 response to lipid 50/344 909/18866## GO:0019725 GO:0019725 cellular homeostasis 47/344 971/18866## GO:0023061 GO:0023061 signal release 33/344 564/18866## GO:0055082 GO:0055082 cellular chemical homeostasis 41/344 827/18866## GO:0051046 GO:0051046 regulation of secretion 37/344 702/18866## GO:0009725 GO:0009725 response to hormone 43/344 905/18866## pvalue p.adjust qvalue## GO:0033993 2.639457e-12 1.157402e-08 9.193646e-09## GO:0019725 9.377891e-10 2.056103e-06 1.633234e-06## GO:0023061 4.079967e-09 5.516571e-06 4.382004e-06## GO:0055082 6.279164e-09 5.516571e-06 4.382004e-06## GO:0051046 7.429653e-09 5.516571e-06 4.382004e-06## GO:0009725 9.083416e-09 5.516571e-06 4.382004e-06simplifyGOFromMultipleLists(lt, padj_cutoff = 0.001)
小编总结
simpleEnrichment包能够让我们在繁多的GO terms中找到重点,从而更好的进行下一步分析,在实际使用过程中,由于代码简单,还是非常方便的,大家可以在科研中尝试使用哟
- 本文固定链接: https://maimengkong.com/image/1086.html
- 转载请注明: : 萌小白 2022年6月30日 于 卖萌控的博客 发表
- 百度已收录