taoyan:伪码农,R语言爱好者,爱开源。
个人博客: https://ytlogos.github.io/
library(ggplot2)
#使用数据集mtcars演示
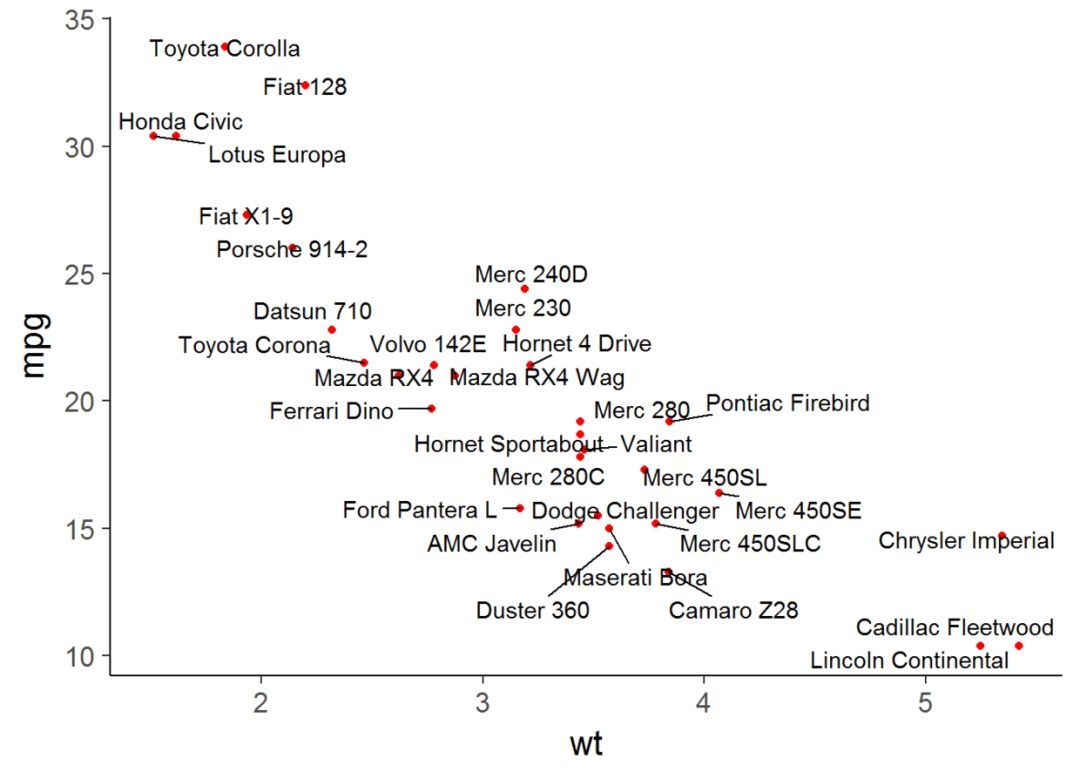
ggplot(mtcars)+ geom_point(aes(wt, mpg), color="red")+geom_text(aes(wt, mpg, label=rownames(mtcars)))+theme_classic(base_size = 16)
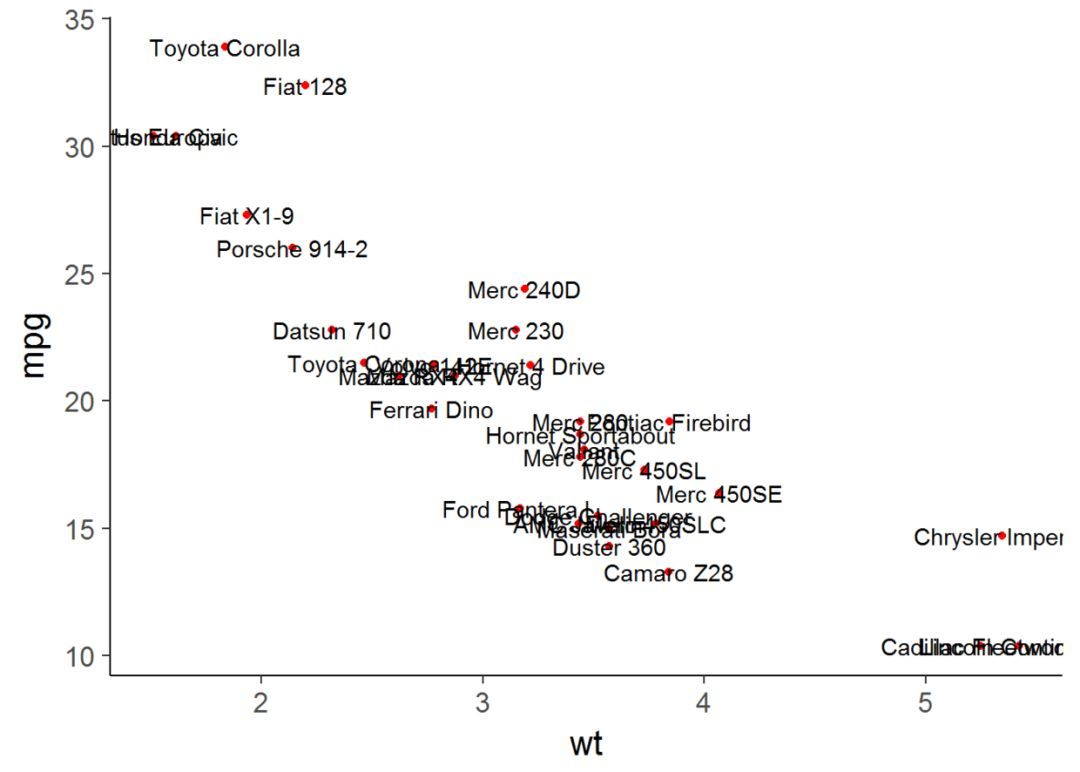
可以看到可视化效果不是很好。接下来看看包ggrepel的效果。
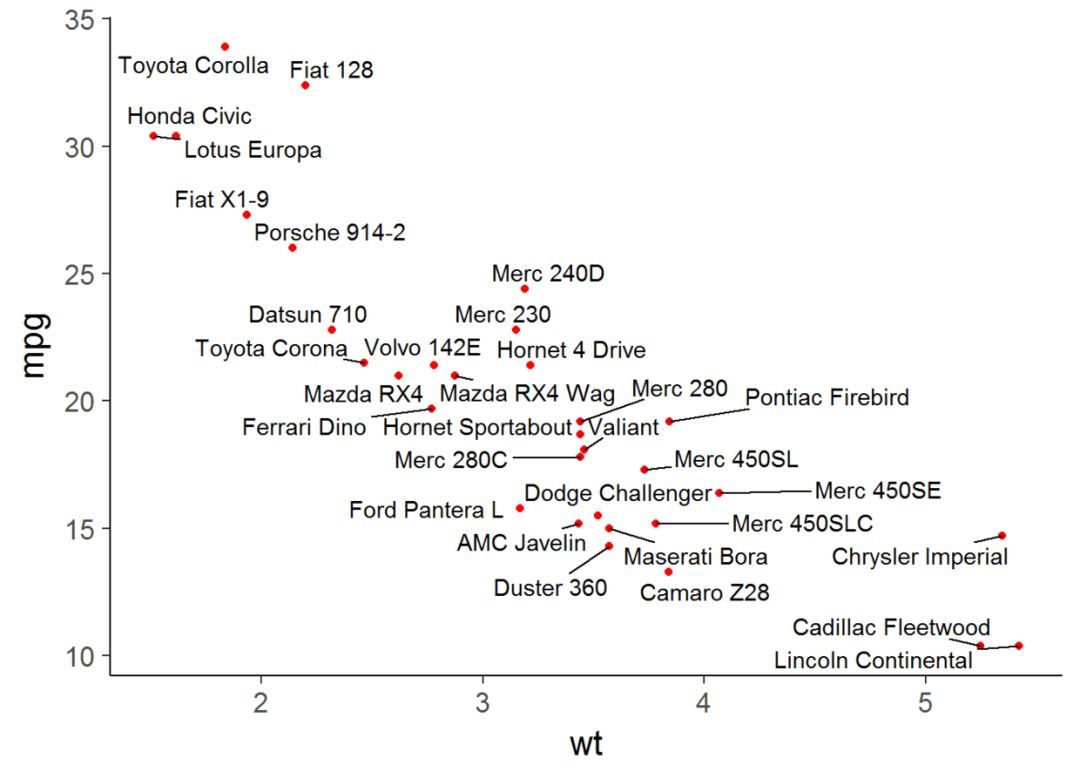
geom_text_repel()是基于geom_text()
library(ggrepel)
set.seed(42)
ggplot(mtcars)+ geom_point(aes(wt, mpg), color="red")+
geom_text_repel(aes(wt, mpg, label=rownames(mtcars)))+
theme_classic(base_size = 16)
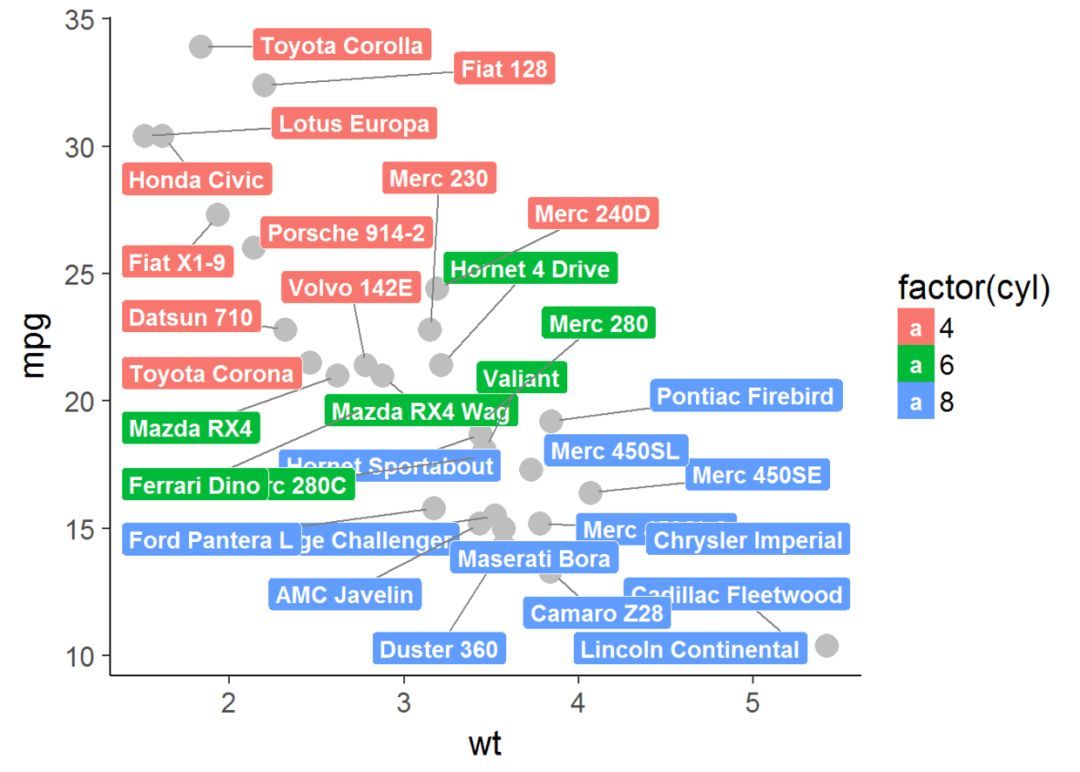
geom_label_repel()
geom_label_repel()是基于geom_label(),它将标签置于一个小方框中
set.seed(42)
ggplot(mtcars)+ geom_point(aes(wt, mpg), color="grey", size=5)+
geom_label_repel(aes(wt, mpg, fill=factor(cyl),
label=rownames(mtcars)), fontface="bold", color="white",
box.padding=unit(0.35, "lines"), point.padding=unit(0.5, "lines"),
segment.colour = "grey50")+ theme_classic(base_size = 16)
参数
大部分geom_text()的参数都适用于geom_text_repel(),除了以下几个:
- hjust
- vjust
- position
- check_overlap
ggrepel包为geom_text_repel()与geom_label_repel()提供了特有的参数设置:
- segment.color:连接点与标签的线段的颜色
- segment.size:线段的粗细
- segment.alpha:线段的透明度
- box.padding:文本框周边填充
- point.padding:点周围填充
- arrow:grid:arrow提供的箭头
- force:强制性将重叠文本散开
- max.oter:最大迭代次数
- nudge_x/y:标签开始位置在坐标轴的移动距离
- direction:允许标签的方向,x、y or both
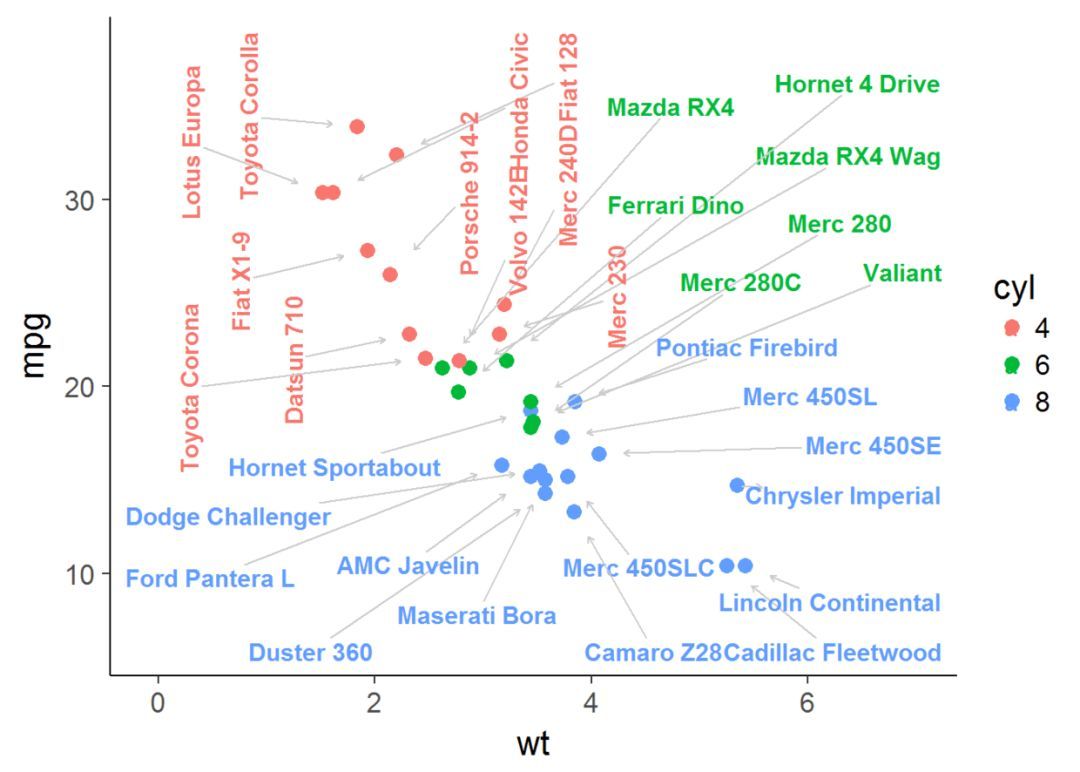
下面举个栗子来详细了解这些参数的图形效果
set.seed(42)
ggplot(mtcars)+ geom_point(aes(wt, mpg, color=factor(cyl)), size=3)+
geom_text_repel(aes(wt, mpg, color=factor(cyl),
label=rownames(mtcars), angle=ifelse(mtcars$cyl==4, 90, 0)),
size=4, family="Times", fontface="bold",
box.padding=unit(0.5, "lines"), point.padding=unit(1.6, "lines"),
segment.color = "#cccccc", segment.size = 0.5,
arrow = arrow(length=unit(0.01, "npc")),force = 1, max.iter = 3e3,
nudge_x = ifelse(mtcars$cyl==6, 2, 0), nudge_y = ifelse(mtcars$cyl==6, 9, 0))+
scale_color_discrete(name="cyl")+
scale_x_continuous(expand = c(0.5, 0))+
scale_y_continuous(expand = c(0.25, 0))+
theme_classic(base_size = 16)

也可以通过设置参数point.padding=NA不对点进行repel
set.seed(42)
mtcars$label <- rownames(mtcars)
ggplot(mtcars, aes(wt, mpg, label=label))+
geom_point(color="red")+ geom_text_repel(point.padding = NA)+
theme_classic(base_size = 16)
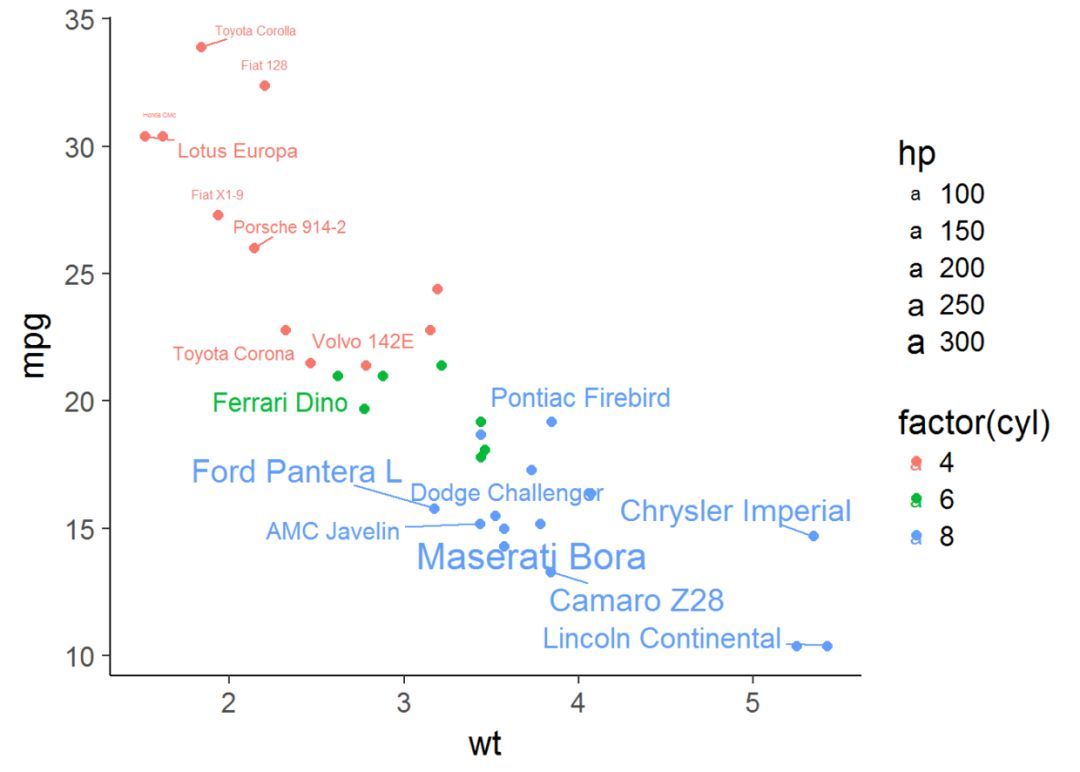
通过赋值某些label空字符“”来隐藏。
set.seed(42)
mtcars$label <- rownames(mtcars)
mtcars$label[1:15] <- ""
ggplot(mtcars, aes(wt, mpg))+ geom_point(aes(color=factor(cyl)), size=2)+
geom_text_repel(aes(color=factor(cyl), size=hp, label=label),
point.padding = unit(0.25, "lines"), box.padding = unit(0.25, "lines"),
nudge_y = 0.1)+ theme_classic(base_size = 16)
将标签控制在特定区域
通过设置参数xlim和ylim来限制label的位置
set.seed(42)
data <- mtcars
mu <- mean(data$wt)
left <- data[data$wt <mu, ]
right <- data[data$wt>=mu, ]
ggplot()+ geom_vline(xintercept = mu)+
geom_point(aes(wt, mpg), data=data)+
geom_text_repel(data=left, aes(wt, mpg, label=rownames(left),
color="Left half"), xlim=c(NA, mu))+
geom_text_repel(data=right, aes(wt, mpg, label=rownames(right),
color="Rigth half"), xlim=c(mu, NA))+ theme_classic(base_size = 16)

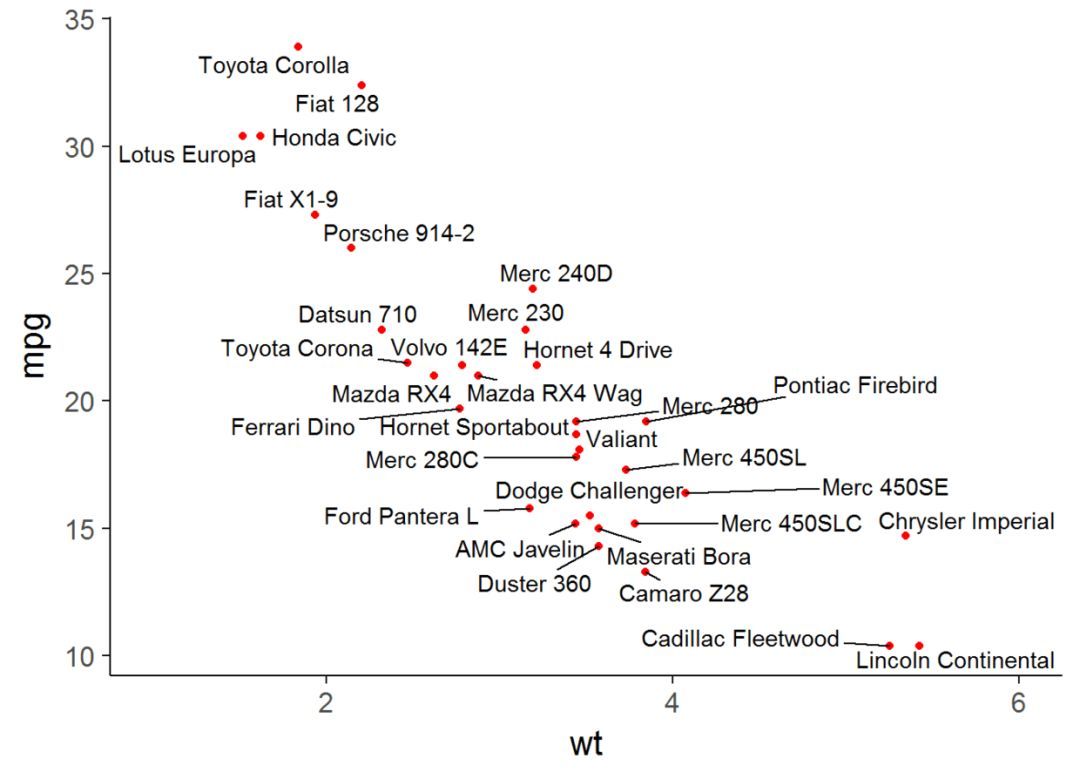
通过控制参数direction来决定label是左右移动还是上下移动, 默认是both
set.seed(42)
#direction="x" 左右移动
ggplot(mtcars)+
geom_point(aes(wt, mpg), color="red")+
geom_text_repel(aes(wt, mpg, label=rownames(mtcars)), direction="x")+
theme_classic(base_size = 16)+xlim(1, 6)
#direction="x" 上下移动
ggplot(mtcars)+
geom_point(aes(wt, mpg), color="red")+
geom_text_repel(aes(wt, mpg, label=rownames(mtcars)), direction="y")+
theme_classic(base_size = 16)+xlim(1, 6)

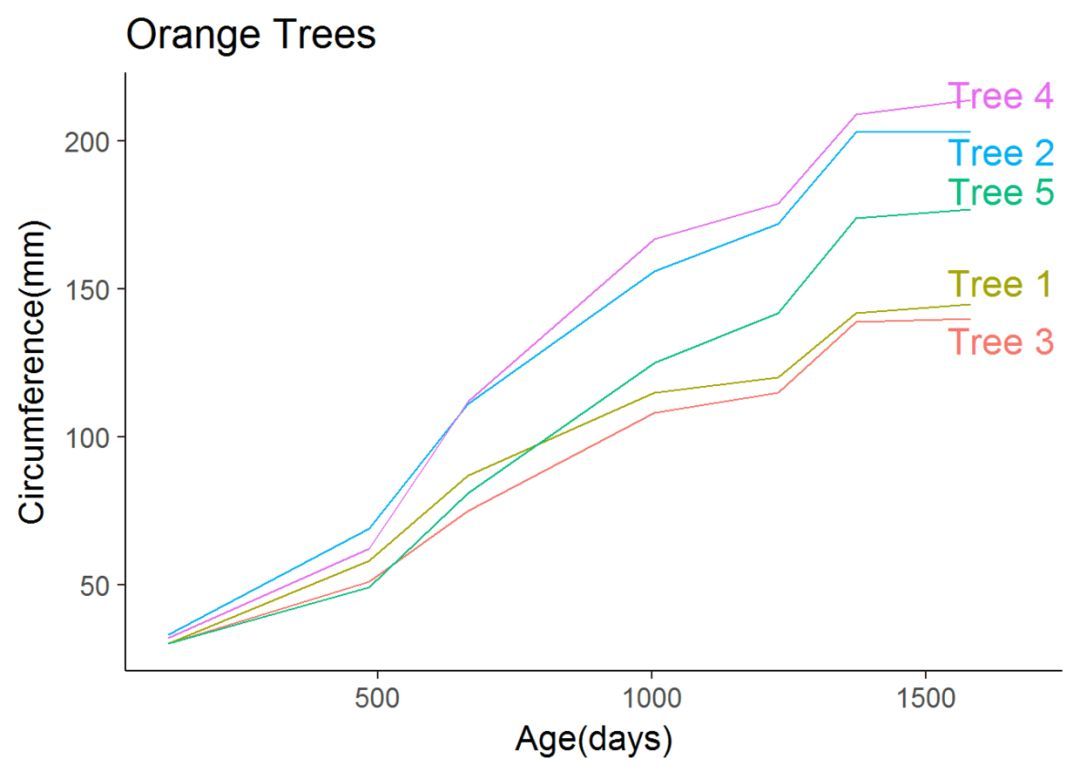
线图
set.seed(42)
ggplot(Orange, aes(age, circumference, color=Tree))+
geom_line()+
coord_cartesian(xlim=c(min(Orange$age), max(Orange$age)+90))+
geom_text_repel(data=subset(Orange, age==max(age)),
aes(label=paste("Tree", Tree)),size=6, nudge_x = 45, segment.color = NA)+
theme_classic(base_size = 16)+
theme(legend.position = "none")+
labs(title="Orange Trees", x="Age(days)", y="Circumference(mm)")
SessionInfo
sessionInfo()
## R version 3.4.0 (2017-04-21)
## Platform: x86_64-w64-mingw32/x64 (64-bit)
## Running under: Windows 8.1 x64 (build 9600)
##
## Matrix products: default
##
## locale:
## [1] LC_COLLATE=Chinese (Simplified)_China.936
## [2] LC_CTYPE=Chinese (Simplified)_China.936
## [3] LC_MONETARY=Chinese (Simplified)_China.936
## [4] LC_NUMERIC=C
## [5] LC_TIME=Chinese (Simplified)_China.936
##
## attached base packages:
## [1] stats graphics grDevices utils datasets methods base
##
## other attached packages:
## [1] ggrepel_0.6.5 ggplot2_2.2.1
##
## loaded via a namespace (and not attached):
## [1] Rcpp_0.12.11 digest_0.6.12 rprojroot_1.2 plyr_1.8.4
## [5] grid_3.4.0 gtable_0.2.0 backports_1.1.0 magrittr_1.5
## [9] evaluate_0.10 scales_0.4.1 rlang_0.1.1 stringi_1.1.5
## [13] lazyeval_0.2.0 rmarkdown_1.5 labeling_0.3 tools_3.4.0
## [17] stringr_1.2.0 munsell_0.4.3 yaml_2.1.14 compiler_3.4.0
## [21] colorspace_1.3-2 htmltools_0.3.6 knitr_1.16 tibble_1.3.3- 本文固定链接: https://maimengkong.com/image/1018.html
- 转载请注明: : 萌小白 2022年6月23日 于 卖萌控的博客 发表
- 百度已收录